High Level Graphs update
By Genevieve Buckley
Executive Summary
There is a lot of work happening in Dask right now on high level graphs. We’d like to share a snapshot of current work in this area. This post is for people interested in technical details of behind the scenes work improving performance in Dask. You don’t need to know anything about it in order to use Dask.
Contents
- Brief background
- Blockwise layers progress
- A high level graph for map overlap
- Slicing and high level graphs
- Visualization
- Documentation
Brief background
What are high level graphs?
High level graphs are a more compact representation of instructions needed to generate the full low level task graph. The documentation page on Dask high level graphs is here: https://docs.dask.org/en/latest/high-level-graphs.html
Why are they useful?
High level graphs are useful for faster scheduling. Instead of sending very large task graphs between the scheduler and the workers, we can instead send the smaller high level graph representation to the worker. Reducing the amount of data that needs to be passed around allows us to improve the overall performance.
You can read more about faster scheduling in our previous blogpost. More recently, Adam Breindel has written about this over on the Coiled blog (link).
Do I need to change my code to use them?
No, you won’t need to change anything. This work is being done under the hood in Dask, and you should see some speed improvements without having to change anything in your code.
In fact, you might already be benefitting from high level graphs:
“Starting with Dask 2021.05.0, Dask DataFrame computations will start sending HighLevelGraph’s directly from the client to the scheduler by default. Because of this, users should observe a much smaller delay between when they call .compute() and when the corresponding tasks begin running on workers for large DataFrame computations” https://coiled.io/blog/dask-heartbeat-by-coiled-2021-06-10/
Read on for a snapshot of progress in other areas.
Blockwise layers progress
Summary
The Blockwise high level graph layer was introduced in the 2020.12.0 Dask release. Since then, there has been a lot of effort made to use Blockwise high level graph layer whereever possible for improved performance, most especially for IO operations. The following is a non-exhaustive list.
Work to date
Highlights include (in no particular order):
- Merged PR by Rick Zamora: Use Blockwise for DataFrame IO (parquet, csv, and orc) #7415
- Merged PR by Rick Zamora: Move read_hdf to Blockwise 7625
- Merged PR by Rick Zamora: Move timeseries and daily-stock to Blockwise #7615
- Merged PR by John Kirkham: Rewrite da.fromfunction w/ da.blockwise #7704
Ongoing work
Lots of other work with Blockwise is currently in progress:
- Ian Rose: Blockwise array creation redux #7417. This PR creates blockwise implementations for the
from_arrayandfrom_zarrfunctions. - Rick Zamora: Move DataFrame from_array and from_pandas to Blockwise #7628
- Bruce Merry: Use BlockwiseDep for map_blocks with block_id or block_info #7686
A high level graph for map overlap
Summary
Investigating a high level graph for Dask’s map_overlap is a project driven by user needs. People have told us that the time taken just to generate the task graph (before any actual computation takes place) can sometimes be a big user experience problem. So, we’re looking in to ways to improve it.
Work to date
- Merged PR by Genevieve Buckley: A HighLevelGraph abstract layer for map_overlap #7595
This PR defers much of the computation involved in creating the Dask task graph, but does not does not reduce the total end-to-end computation time. Further optimization is therefore required.
Ongoing work
Followup work includes:
- Find number of tasks in overlap layer without materializing the layer #7788 https://github.com/dask/dask/issues/7788
- Implement cull method for ArrayOverlapLayer #7789 https://github.com/dask/dask/issues/7789 (culling is simplifying a Dask graph by removing unnecessary tasks)
Slicing and high level graphs
Summary
Profiling map_overlap, we saw that a lot of time is being spent in slicing operations. So, slicing was a logical next step to investigate possible performance improvements with high level graphs.
Meanwhile, Rick Zamora has been working on the dataframe side of Dask, using high level graphs to improve dataframe slicing/selections.
Work to date
A couple of minor bugfixes/improvements:
-
Merged PR by Genevieve Buckley: SimpleShuffleLayer should compare parts_out with set(self.parts_out) #7787
-
Merged PR by Genevieve Buckley: Make Layer get_output_keys officially an abstract method #7775
Ongoing work
-
Rick Zamora: [WIP] Add DataFrameGetitemLayer to simplify HLG Optimizations #7663
-
Genevieve Buckley: Array slicing HighLevelGraph layer #7655
Visualization
Summary
We’ve also put some work into making better visualizations for Dask objects (including high level graphs).
Defining a _repr_html_ method for your classes is a great way to get nice HTML output when you’re working with jupyter notebooks. You can read this post to see more neat HTML representations in other scientific python libraries.
Dask already uses HTML representations in lots of places (like the Array and Dataframe classes). We now have new HTML representations for HighLevelGraph and Layer objects, as well as Scheduler and Client objects in Dask distributed.
Work to date
- Merged PR by Jacob Tomlinson: Add HTML repr to scheduler_info and incorporate into client and cluster reprs #4857
- Merged PR by Jacob Tomlinson: HTML reprs CLient.who_has & Client.has_what
- Merged PR by Genevieve Buckley: Implementation of HTML repr for HighLevelGraph layers #7763 https://github.com/dask/dask/pull/7763
- Merged PR by Genevieve Buckley Automatically show graph visualization in jupyter notebooks #771
- Merged PR by Genevivee Buckley: Adding chunks and type information to dask high level graphs #7309. This PR inserts extra information into the high level graph, so that we can create richer visualizations using this extra context later on.
Example
Before:
<dask.highlevelgraph.HighLevelGraph at 0x7f9851b7e4f0>
After (HTML representation):
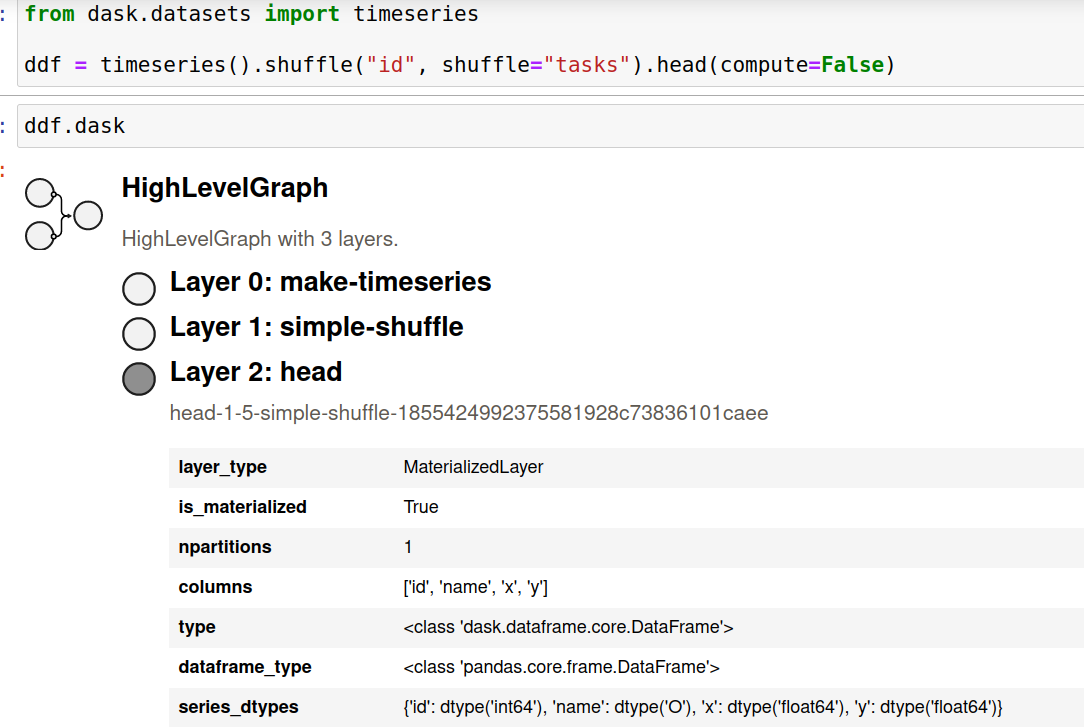
After (text-only representation):
from dask.datasets import timeseries

ddf = timeseries().shuffle("id", shuffle="tasks").head(compute=False)
ddf.dask
HighLevelGraph with 3 layers.
<dask.highlevelgraph.HighLevelGraph object at 0x7fc259015b80>
 0. make-timeseries-94aab6e7236cbd9828bcbfb35fe6caee
 1. simple-shuffle-cd01443e43b7a6eb9810ad67992c40b6
 2. head-1-5-simple-shuffle-cd01443e43b7a6eb9810ad67992c40b6
This gives us a much more meaningful representation, and is already being used by developers working on high level graphs.
Documentation
Finally, the documentation around high level graphs is sparse. This is because they’re relatively new, and have also been undergoing quite a bit of change. However, this makes it difficult for people. We’re planning to improve the documentation, for both users and devlopers of Dask.
If you’d like to follow these discussions, or help out, you can subscribe to the issues:
- For Dask users: Update HighLevelGraph documentation #7709
- For Dask developers: Document dev process around high level graphs #7755
blog comments powered by Disqus