Streaming Dataframes
This work is supported by Anaconda Inc and the Data Driven Discovery Initiative from the Moore Foundation
This post is about experimental software. This is not ready for public use. All code examples and API in this post are subject to change without warning.
Summary
This post describes a prototype project to handle continuous data sources of tabular data using Pandas and Streamz.
Introduction
Some data never stops. It arrives continuously in a constant, never-ending stream. This happens in financial time series, web server logs, scientific instruments, IoT telemetry, and more. Algorithms to handle this data are slightly different from what you find in libraries like NumPy and Pandas, which assume that they know all of the data up-front. It’s still possible to use NumPy and Pandas, but you need to combine them with some cleverness and keep enough intermediate data around to compute marginal updates when new data comes in.
Example: Streaming Mean
For example, imagine that we have a continuous stream of CSV files arriving and we want to print out the mean of our data over time. Whenever a new CSV file arrives we need to recompute the mean of the entire dataset. If we’re clever we keep around enough state so that we can compute this mean without looking back over the rest of our historical data. We can accomplish this by keeping running totals and running counts as follows:
total = 0
count = 0

for filename in filenames:  # filenames is an infinite iterator
    df = pd.read_csv(filename)
    total = total + df.sum()
    count = count + df.count()
    mean = total / count
    print(mean)
Now as we add new files to our filenames iterator our code prints out new
means that are updated over time. We don’t have a single mean result, we have
continuous stream of mean results that are each valid for the data up to that
point. Our output data is an infinite stream, just like our input data.
When our computations are linear and straightforward like this a for loop suffices. However when our computations have several streams branching out or converging, possibly with rate limiting or buffering between them, this for-loop approach can grow complex and difficult to manage.
Streamz
A few months ago I pushed a small library called streamz, which handled control flow for pipelines, including linear map operations, operations that accumulated state, branching, joining, as well as back pressure, flow control, feedback, and so on. Streamz was designed to handle all of the movement of data and signaling of computation at the right time. This library was quietly used by a couple of groups and now feels fairly clean and useful.
Streamz was designed to handle the control flow of such a system, but did nothing to help you with streaming algorithms. Over the past week I’ve been building a dataframe module on top of streamz to help with common streaming tabular data situations. This module uses Pandas and implements a subset of the Pandas API, so hopefully it will be easy to use for programmers with existing Python knowledge.
Example: Streaming Mean
Our example above could be written as follows with streamz
source = Stream.filenames('path/to/dir/*.csv')  # stream of filenames
sdf = (source.map(pd.read_csv)                  # stream of Pandas dataframes
             .to_dataframe(example=...))        # logical streaming dataframe

sdf.mean().stream.sink(print)                   # printed stream of mean values
This example is no more clear than the for-loop version. On its own this is probably a worse solution than what we had before, just because it involves new technology. However it starts to become useful in two situations:
-
You want to do more complex streaming algorithms
sdf = sdf[sdf.name == 'Alice']
sdf.x.groupby(sdf.y).mean().sink(print)

# or

sdf.x.rolling('300ms').mean()
It would require more cleverness to build these algorithms with a for loop as above.
-
You want to do multiple operations, deal with flow control, etc..
sdf.mean().sink(print)
sdf.x.sum().rate_limit(0.500).sink(write_to_database)
...
Consistently branching off computations, routing data correctly, and handling time can all be challenging to accomplish consistently.
Jupyter Integration and Streaming Outputs
During development we’ve found it very useful to have live updating outputs in Jupyter.
Usually when we evaluate code in Jupyter we have static inputs and static outputs:
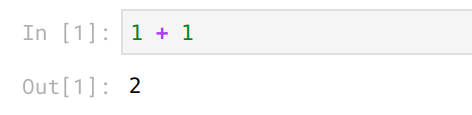
However now both our inputs and our outputs are live:
We accomplish this using a combination of ipywidgets and Bokeh plots both of which provide nice hooks to change previous Jupyter outputs and work well with the Tornado IOLoop (streamz, Bokeh, Jupyter, and Dask all use Tornado for concurrency). We’re able to build nicely responsive feedback whenever things change.
In the following example we build our CSV to dataframe pipeline that updates whenever new files appear in a directory. Whenever we drag files to the data directory on the left we see that all of our outputs update on the right.
What is supported?
This project is very young and could use some help. There are plenty of holes in the API. That being said, the following works well:
Elementwise operations:
sdf['z'] = sdf.x + sdf.y
sdf = sdf[sdf.z > 2]
Simple reductions:
sdf.sum()
sdf.x.mean()
Groupby reductions:
sdf.groupby(sdf.x).y.mean()
Rolling reductions by number of rows or time window
sdf.rolling(20).x.mean()
sdf.rolling('100ms').x.quantile(0.9)
Real time plotting with Bokeh (one of my favorite features)
sdf.plot()
What’s missing?
- Parallel computing: The core streamz library has an optional Dask backend for parallel computing. I haven’t yet made any attempt to attach this to the dataframe implementation.
- Data ingestion from common streaming sources like Kafka. We’re in the process now of building asynchronous-aware wrappers around Kafka Python client libraries, so this is likely to come soon.
- Out-of-order data access: soon after parallel data ingestion (like reading from multiple Kafka partitions at once) we’ll need to figure out how to handle out-of-order data access. This is doable, but will take some effort. This is where more mature libraries like Flink are quite strong.
- Performance: Some of the operations above (particularly rolling operations) do involve non-trivial copying, especially with larger windows. We’re relying heavily on the Pandas library which wasn’t designed with rapidly changing data in mind. Hopefully future iterations of Pandas (Arrow/libpandas/Pandas 2.0?) will make this more efficient.
- Filled out API: Many common operations (like variance) haven’t yet been implemented. Some of this is due to laziness and some is due to wanting to find the right algorithm.
- Robust plotting: Currently this works well for numeric data with a timeseries index but not so well for other data.
But most importantly this needs use by people with real problems to help us understand what here is valuable and what is unpleasant.
Help would be welcome with any of this.
You can install this from github
pip install git+https://github.com/mrocklin/streamz.git
Documentation and code are here:
Current work
Current and upcoming work is focused on data ingestion from Kafka and parallelizing with Dask.
blog comments powered by Disqus