Reducing memory usage in Dask workloads by 80%
By Gabe Joseph (Coiled)
Original version of this post appears on https://www.coiled.io/blog/reducing-dask-memory-usage
There’s a saying in emergency response: “slow is smooth, smooth is fast”.
That saying has always bothered me, because it doesn’t make sense at first, yet it’s entirely correct.
By applying this philosophy to the scheduling algorithm in the latest release of Dask, we’re seeing common workloads use up to 80% less memory than before. This means some workloads that used to be outright un-runnable are now running smoothly—an infinity-X speedup!
The second-most upvoted and commented issue of all time on the dask/distributed repo describes, “tasks early in my graph generate data faster than it can be consumed downstream, causing data to pile up, eventually overwhelming my workers”.
Dask users often struggle with workloads that run out of memory like this. Studying these situations, we realized that the Dask scheduler wasn’t following this “slow is smooth, smooth is fast” adage.
Here’s what the problem was, and how we’ve addressed it:
Historically, Dask tried hard to get each individual task done as fast as possible: if a task could run, it would. So sometimes, tasks would run even if their outputs weren’t going to be used immediately—leaving them sitting around in memory.
If you had thousands of initial tasks loading data—say, fetching Parquet from S3, CSVs from disk, or rows from a database—all those tasks would be scheduled and sent to workers up front.
The workers would churn through them, fetching chunks of data (and accumulating it in memory) as quickly as possible. A worker would tell the scheduler when each chunk was loaded, and the scheduler would respond with what to do with it next—but until that message arrived, there were more data-loading tasks runnable right now, so why not run them?
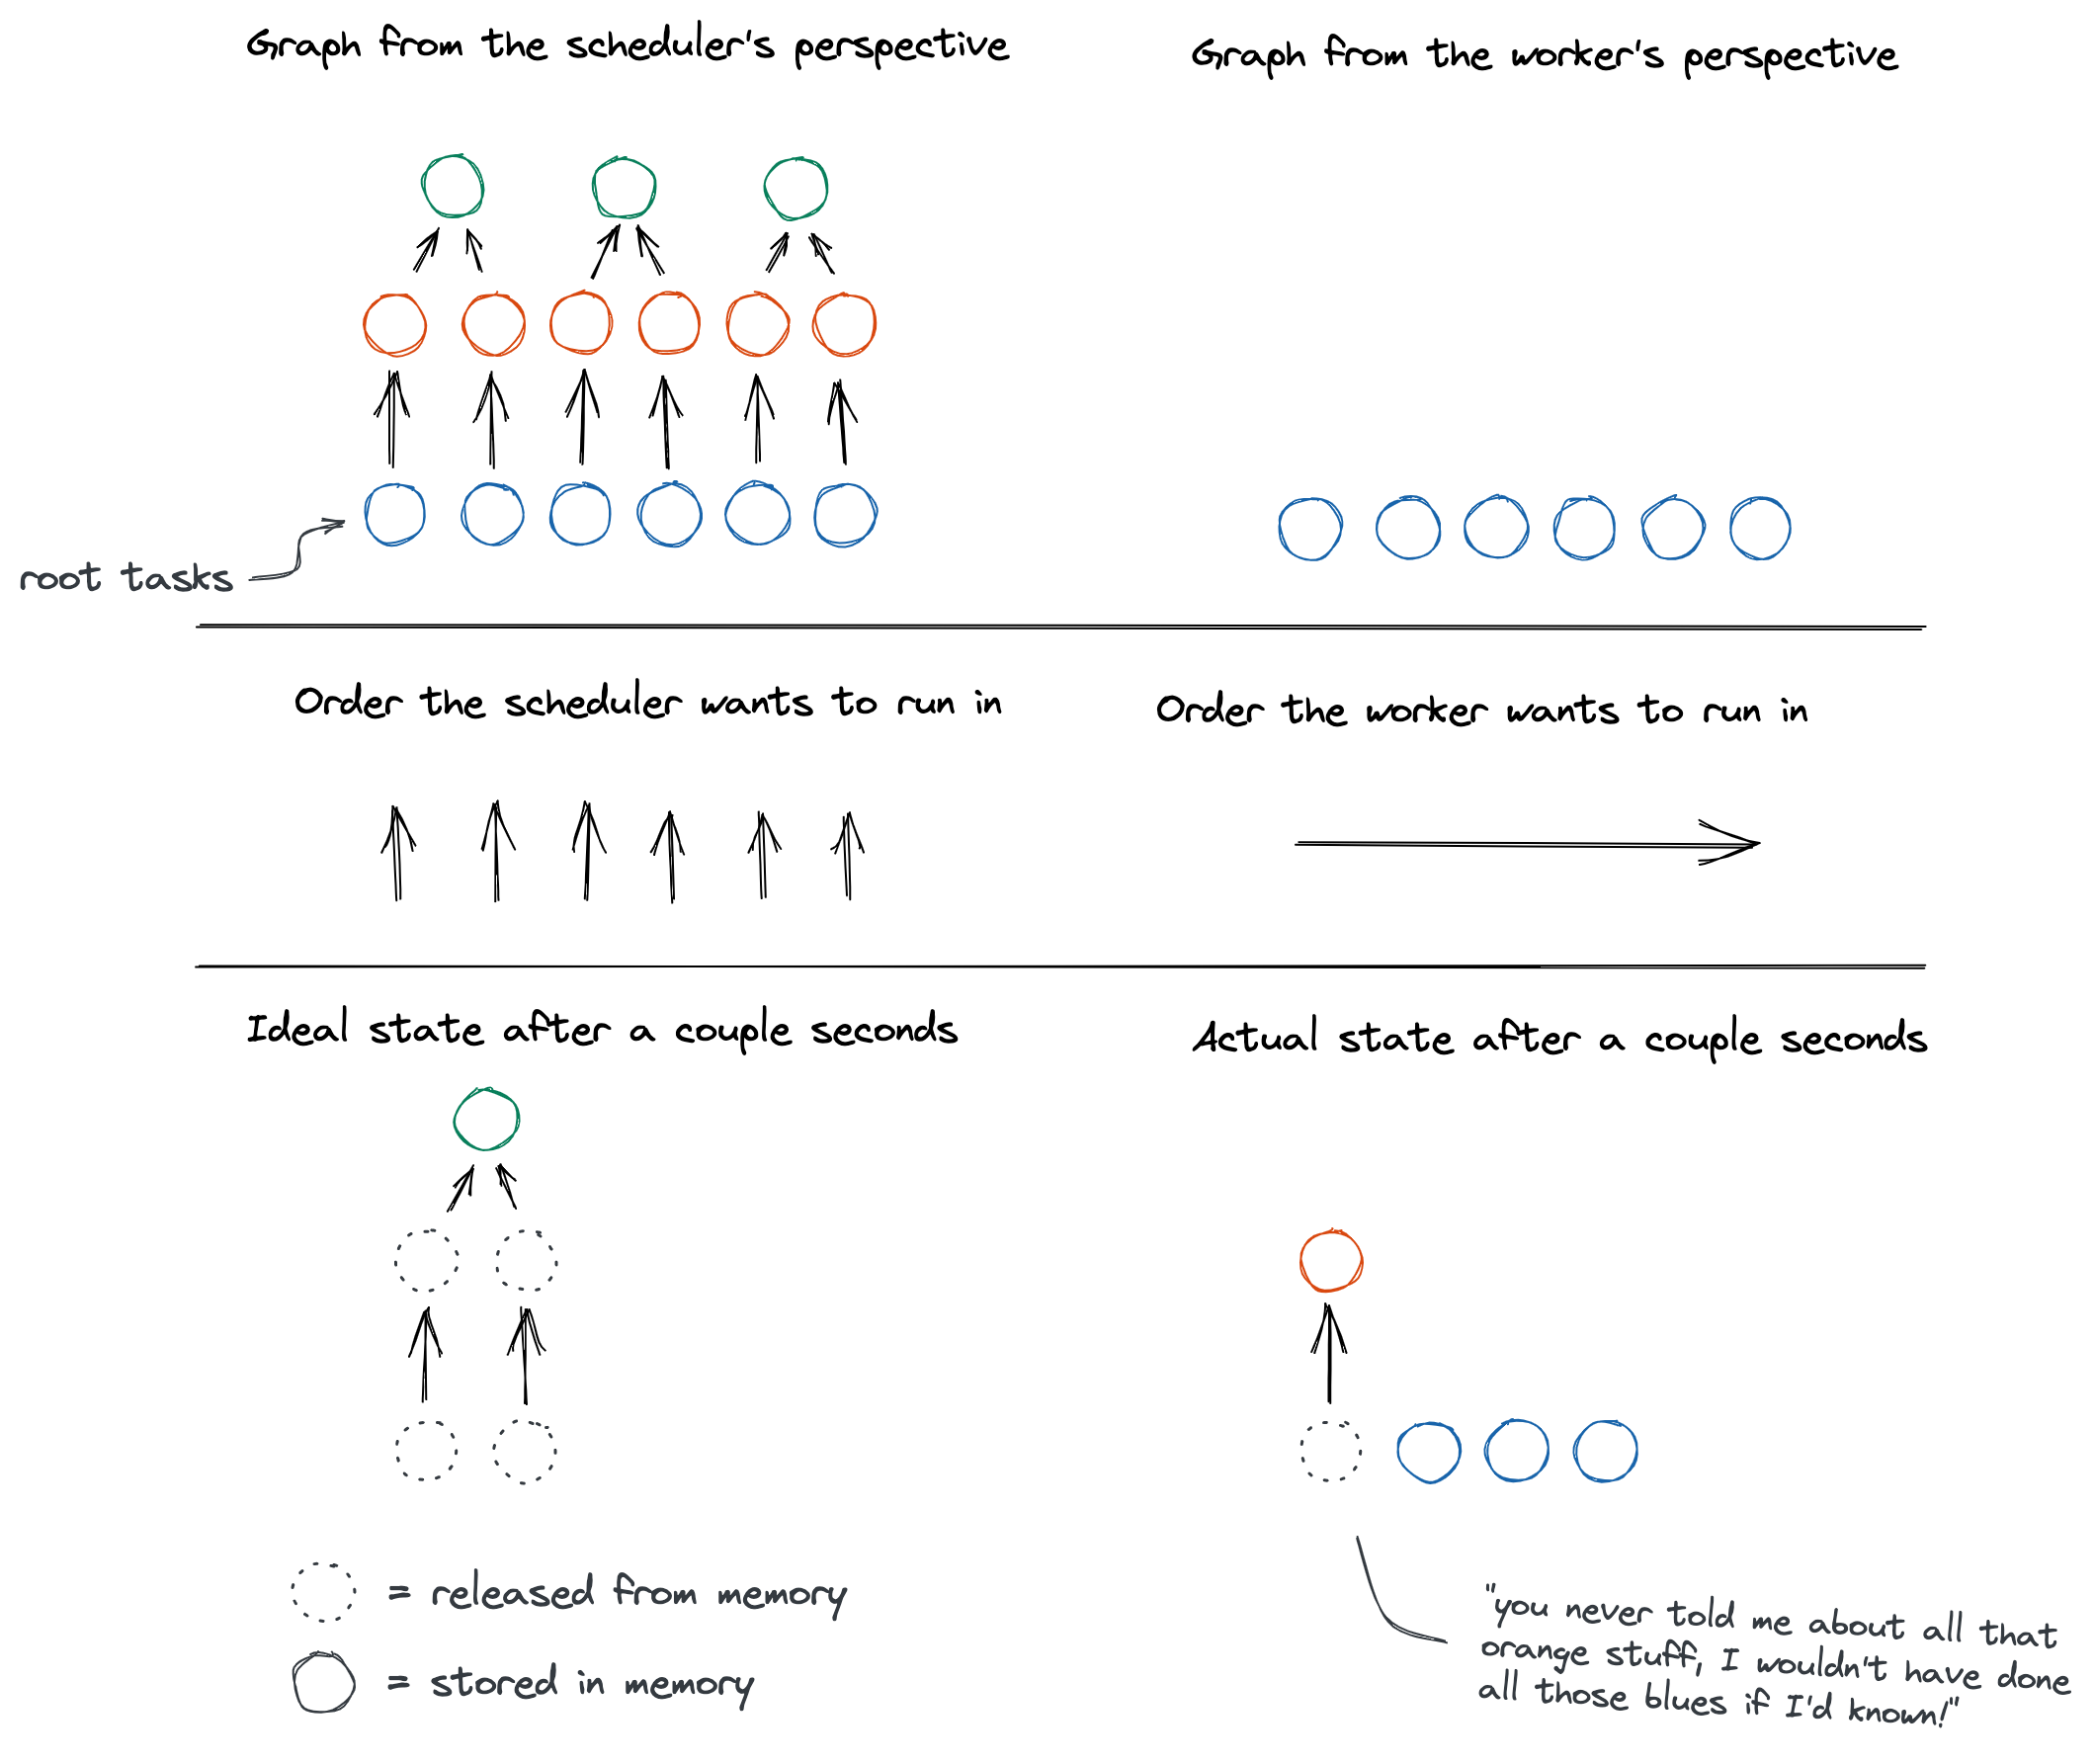
This slight gap in timing—between the worker immediately starting on a less-useful task, then only later finding out about a more-useful task it should have run instead—allowed this lower-priority data to pile up in memory. We call this “root task overproduction”.
Overall, there could be at least twice as much initial data in memory at once as necessary—and, therefore, twice as many intermediate results. (See this comment for a detailed explanation of why the 2x happens.)
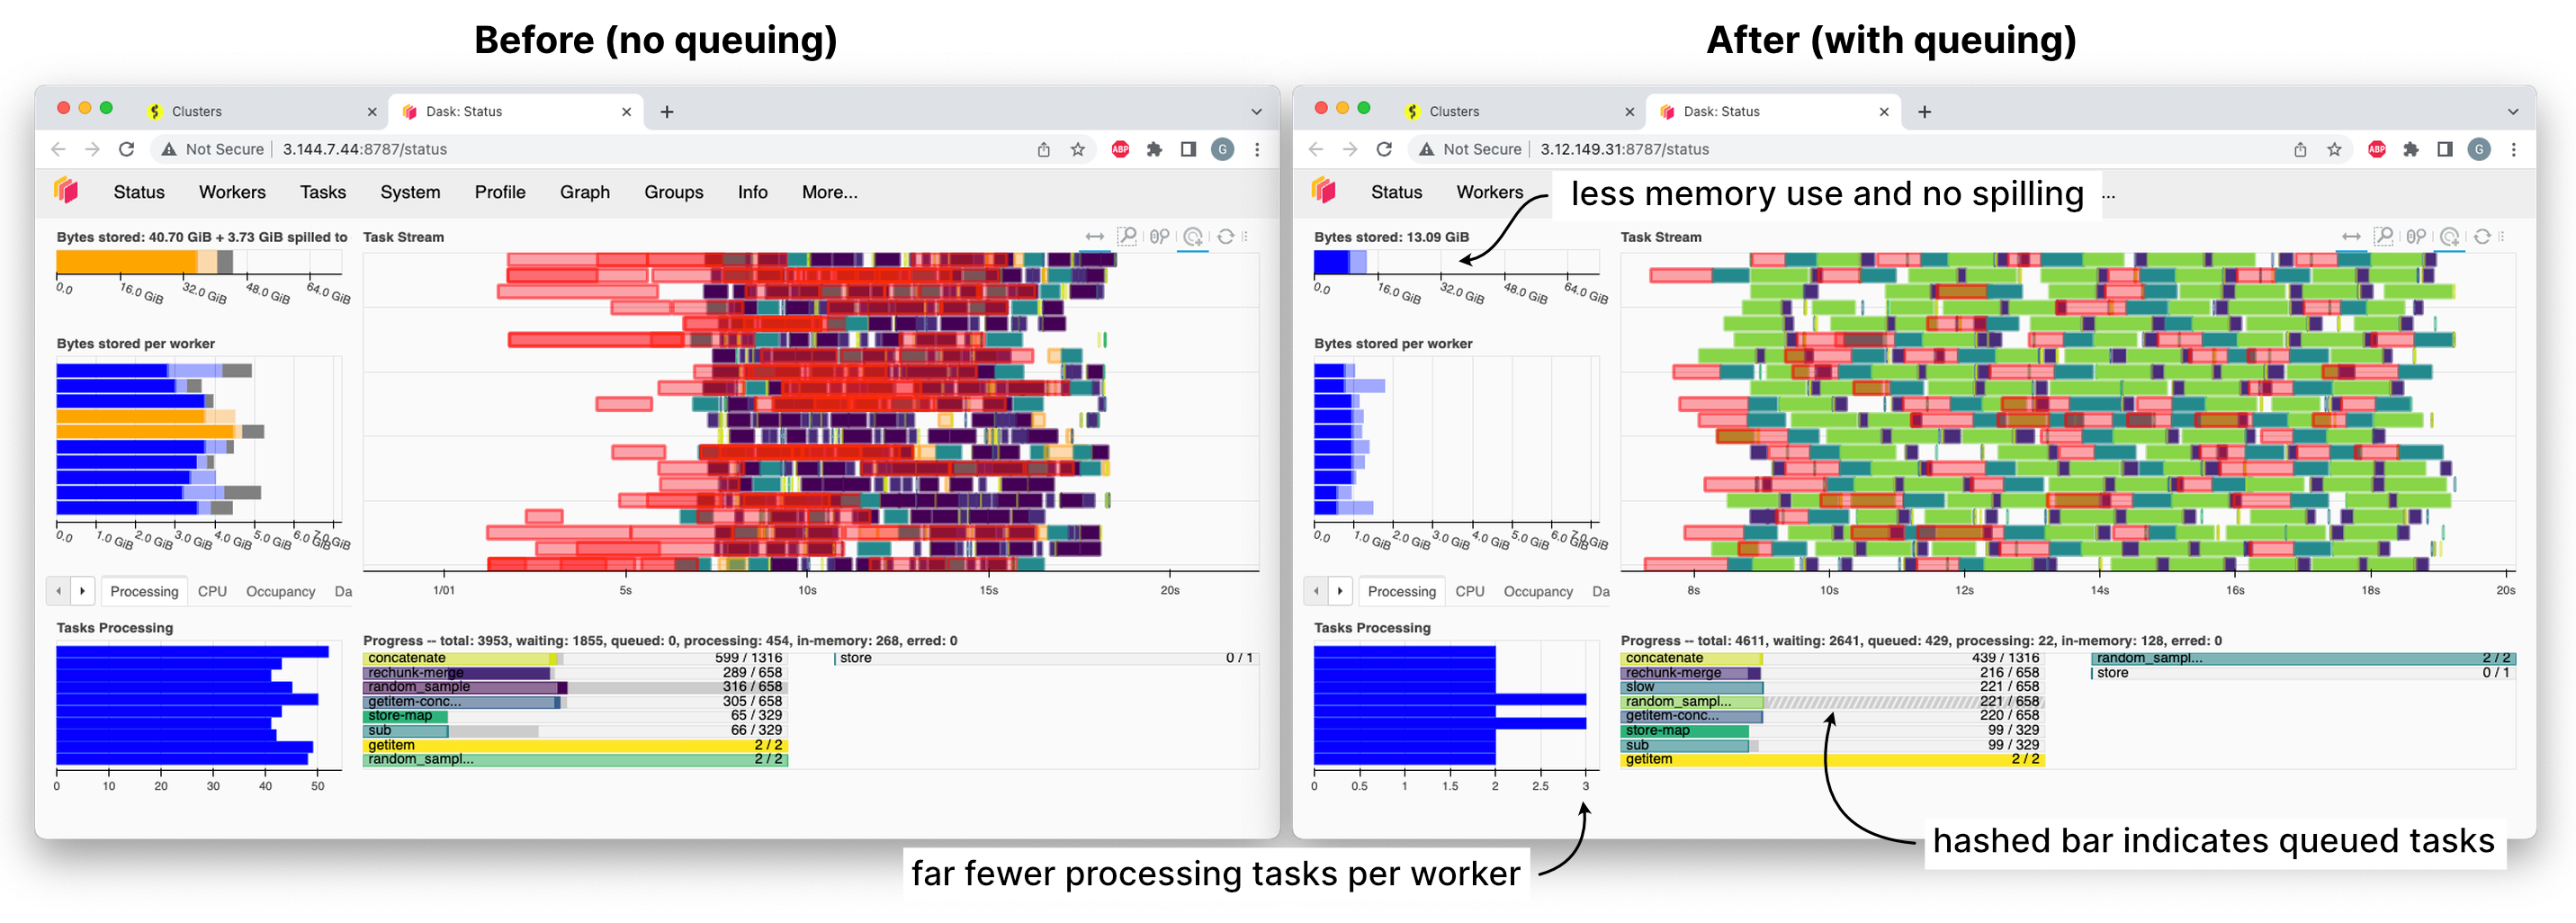
When this put workers under memory pressure, this initial problem would snowball into a bigger one. Workers had to spill data to disk (slow), then read it back from disk to use it or transfer it (slow). Workers might exceed their memory limits and crash, losing progress and requiring tasks to be recomputed on a pool of workers that were already struggling.
In the end, this meant that a whole class of workloads were slow, or even un-runnable, without using hugely oversized clusters.
There were plenty of ways to approach this problem, but we wanted to try the simplest thing first: just don’t tell the workers about more tasks than they can run at once.
We’re calling this mode of scheduling “queuing”, or “root task withholding”. The scheduler puts data-loading tasks in an internal queue, and only drips one out to a worker once it’s finished its current work and there’s nothing more useful to run instead that utilizes the work it just completed.
Slow is smooth
Queuing adds a cost in latency. Every time workers finish a task, they have to ask the scheduler what to do next and sit under-utilized, or even idle, until they get an answer. (Before, they had a backlog of things they could do before the answer came back.)
For a while, we hadn’t considered this approach, because intuitively, we assumed the latency would be too much of a slow-down.
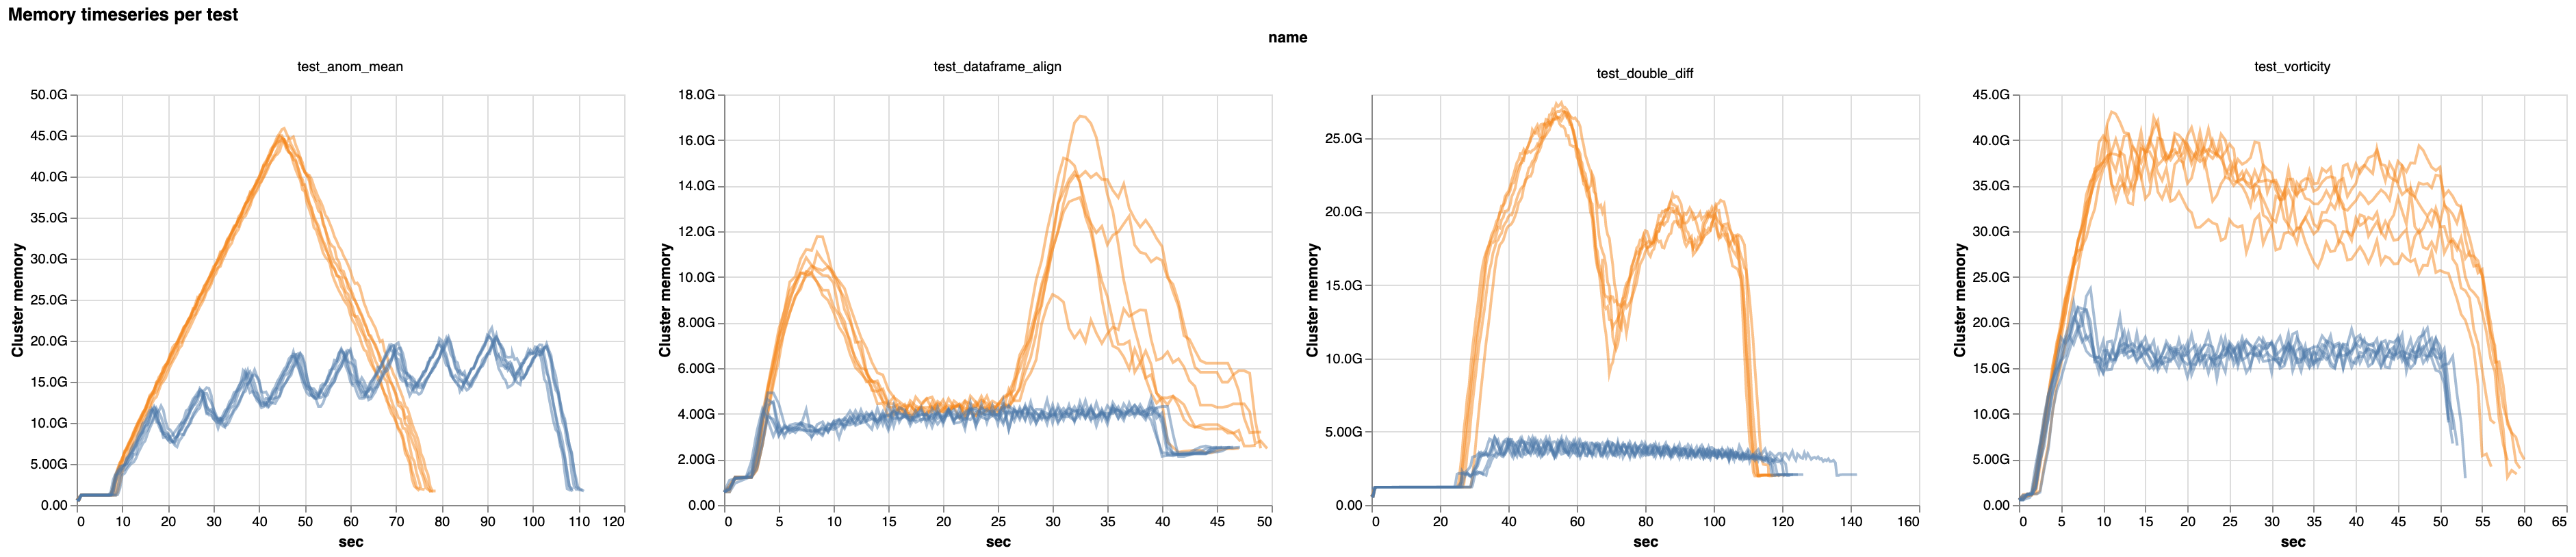
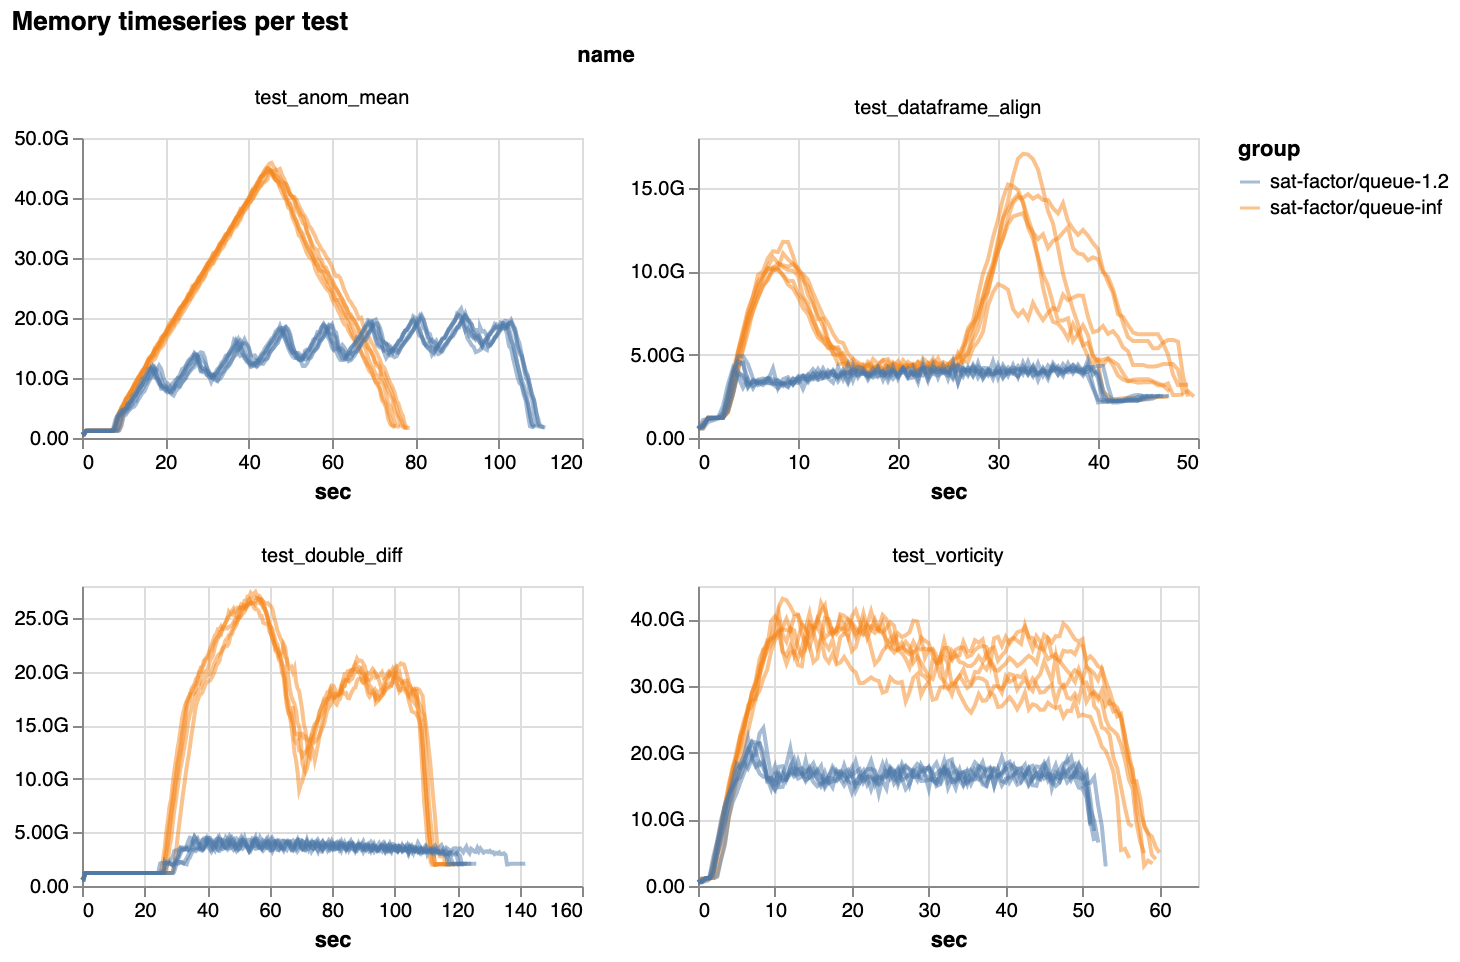
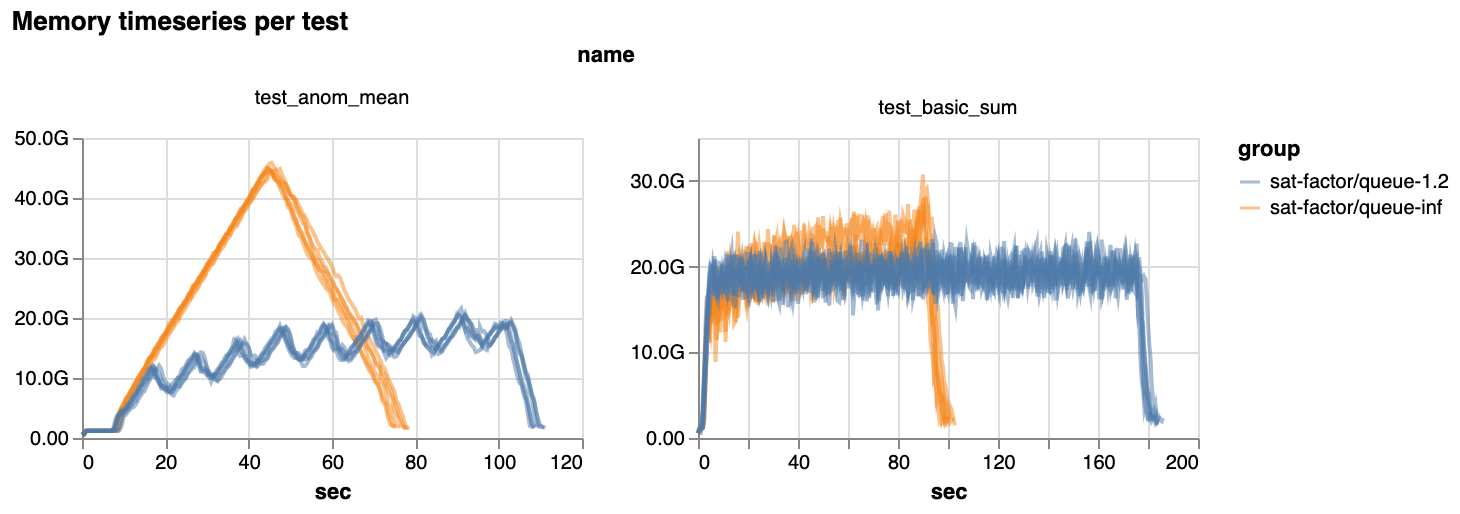
However, by slowing down the pace of task assignment, and running only the best tasks, scheduling gets much smoother. And with that smoothness, we see that most benchmark workloads use much less memory across the board:
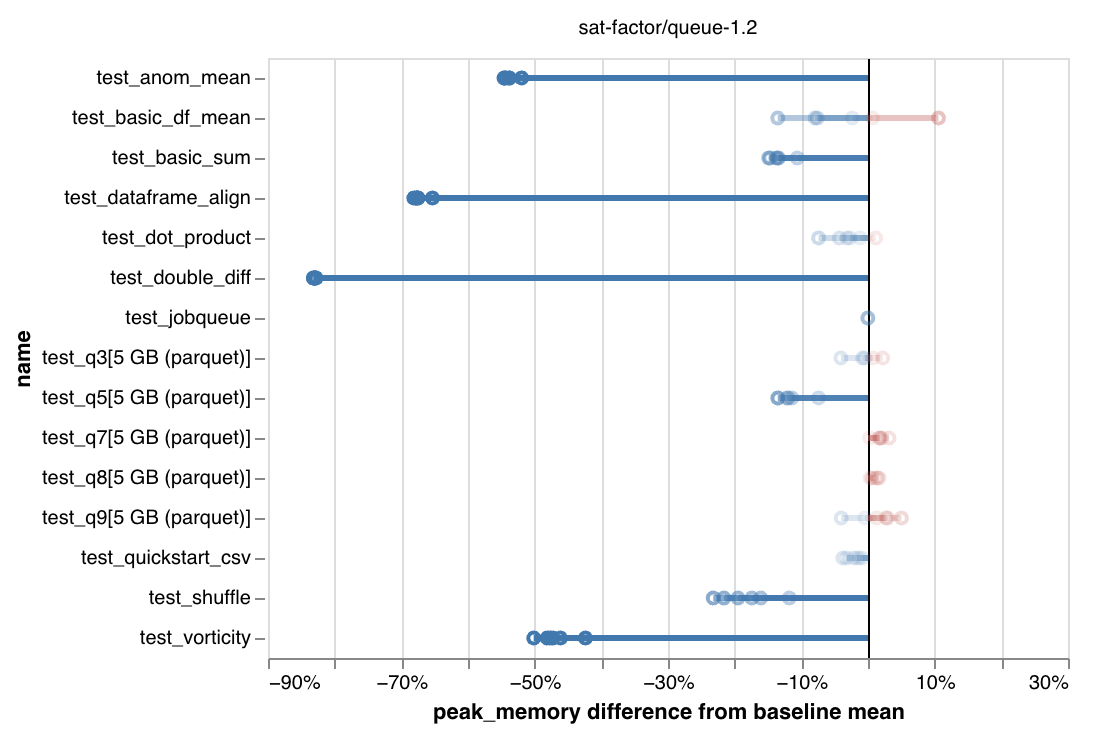
Percent decrease in peak memory used in the latest release. Notice the axes: up to 80% reduction.
This large a reduction in memory use is a big deal!
For many users, this might mean that workloads that weren’t runnable before can now run smoothly.

Julius Busecke reports that a common geoscience task which used to always crash now works out of the box with the new scheduling mode.
Some workloads will also be cheaper to run in the cloud, since they can use instances with less memory. We see some benchmarks that could, in theory, be run for 30-50% less total cost. This is not universal: others would cost more because they get slower. More on that later.
Beyond this, execution is just more predictable. Memory usage is much more consistent and less likely to spike rapidly.
Smooth is fast
In a few cases, it turns out that smooth scheduling can be even faster.
On average, one representative oceanography workload ran 20% faster. A few other workloads showed modest speedups as well. This is mostly because they no longer load too much data into memory and then have to spill it to disk, which creates significant slowdowns.
Additionally, we found that the extra latency we were worried about didn’t actually slow things down in typical cases. There was no measurable change in pure task throughput on a cluster with fast networking and multi-CPU workers, like Coiled clusters or a single-machine LocalCluster. This was a good lesson in trying the simplest thing first.
Sometimes, slow is still slow (but not why you’d expect)
However, we did notice that a few benchmarks run slower with scheduler-side queuing. The typical slowdown is 5-10%, but in the worst case, they are ~50% slower (though they also use about half the memory).
The problem is that implementing queuing meant giving up a scheduling feature introduced last year called co-assignment.
As described in the docs, co-assignment tries to schedule initial tasks on the same worker if their outputs will be combined later. This avoids having to transfer data from one worker to another when the downstream task runs, because all the data is already on one worker.
In a graph like this, we’d want a and b to run on the same worker. Otherwise, one of e or f would have to be transferred between workers before i can run.
  i       j
 / \     / \
e   f   g   h
|   |   |   |
a   b   c   d
Avoiding these transfers speeds things up, because network is relatively slow. It also reduces memory usage by avoiding having to hold replicas of the same data on multiple workers.
Unfortunately, the current implementation of co-assignment isn’t compatible with queuing, and updating it is non-trivial. We plan to do this next, to get the best of both worlds.
But in the short term, we had to decide if queuing was beneficial enough to be worth enabling by default right away, despite the loss of co-assignment.
A new default for scheduling
After running a number of benchmarks, and getting some initial community feedback, we think it is.
Queuing makes things possible that used to not work at all. But it doesn’t break anything that works today: everything will still work, some things just could be slower. We feel that that’s a worthwhile enough tradeoff to enable it by default—especially given how much dask users have struggled with memory issues.
Additionally, to avoid impacting workloads that could become latency-bound, the new algorithm is still doing a little overproduction. It’s pushing a handful of extra root tasks to the worker in advance (as opposed to all of them, like before). This comes at the price of some extra memory use, but prevents painful slowdowns in high-latency clusters.
So in the latest release, queuing is enabled by default. Most memory-intensive Array and DataFrame workloads should see reductions in memory use out of the box, ranging from noticeable to 🤩.
Let us know how it goes
We’ve opened a discussion on GitHub for feedback on this change. Please let us know how it helps (or doesn’t).
Keeping old behavior
For users who are sensitive to runtime and have low memory use, you can deactivate queuing and use the old scheduling mode (including co-assignment) via Dask configuration, by setting the new distributed.scheduler.worker-saturation config value to inf.
You can read more about adjusting this setting in the docs.
On Coiled, you can set it with:
import dask
import coiled

with dask.config.set({"distributed.scheduler.worker-saturation": "inf"}):
    cluster = coiled.Cluster(...)  # coiled sends current dask config automatically
You can see examples of setting this configuration for various deployment systems on the discussion issue (when copy-pasting, be sure to change the 1.0 to inf!). And if you find the need to set worker-saturation back to inf, please let us know on the discussion.
blog comments powered by Disqus