Measuring Dask memory usage with dask-memusage
Using too much computing resources can get expensive when you’re scaling up in the cloud.
To give a real example, I was working on the image processing pipeline for a spatial gene sequencing device, which could report not just which genes were being expressed but also where they were in a 3D volume of cells. In order to get this information, a specialized microscope took snapshots of the cell culture or tissue, and the resulting data was run through a Dask pipeline.
The pipeline was fairly slow, so I did some back-of-the-envelope math to figure out our computing costs would be once we started running more data for customers. It turned out that we’d be using 70% of our revenue just paying for cloud computing!
Clearly I needed to optimize this code.
When we think about the bottlenecks in large-scale computation, we often focus on CPU: we want to use more CPU cores in order to get faster results. Paying for all that CPU can be expensive, as in this case, and I did successfully reduce CPU usage by quite a lot.
But high memory usage was also a problem, and fixing that problem led me to build a series of tools, tools that can also help you optimize and reduce your Dask memory usage.
In the rest of this article you will learn:
- How high memory usage can drive up your computing costs.
- How a tool called dask-memusage can help you find peak memory usage of the tasks in your Dask execution graph.
- How to further pinpoint high memory usage using the Fil memory profiler, so you can reduce memory usage.
The problem: fixed processing chunks and a high memory/CPU ratio
As a reminder, I was working on a Dask pipeline that processed data from a specialized microscope.
The resulting data volume was quite large, and certain subsets of images had to be processed together as a unit.
From a computational standpoint, we effectively had a series of inputs X0, X1, X2, … that could be independently processed by a function f().
The internal processing of f() could not easily be parallelized further.
From a CPU scheduling perspective, this was fine, it was still an embarrassingly parallel problem given the large of number of X inputs.
For example, if I provisioned a virtual machine with 4 CPU cores, to process the data I could start four processes, and each would max out a single core. If I had 12 inputs and each processing step took about the same time, they might run as follows:
- CPU0:
f(X0),f(X4),f(X8) - CPU1:
f(X1),f(X5),f(X9) - CPU2:
f(X2),f(X6),f(X10) - CPU3:
f(X3),f(X7),f(X11)
If I could make f() faster, the pipeline as a whole would also run faster.
CPU is not the only resource used in computation, however: RAM can also be a bottleneck.
For example, let’s say each call to f(Xi) took 12GB of RAM.
That means to fully utilize 4 CPUs, I would need 48GB of RAM—but what if my computer only has 16GB of RAM?
Even though my computer has 4 CPUs, I can only utilize one CPU on a computer with 16GB RAM, because I don’t have enough RAM to run more than one task in parallel. In practice, these tasks ran in the cloud, where I could ensure the necessary RAM/core ratio was preserved by choosing the right pre-configured VM instances. And on some clouds you can freely set the amount of RAM and number of CPU cores for each virtual machine you spin up.
However, I didn’t quite know how much memory was used at peak, so I’d had to limit parallelism to reduce out-of-memory errors. As a result, the default virtual machines we were using had half their CPUs resting idle, resources were paying for but not using.
In order to provision hardware appropriately and max out all the CPUs, I needed to know how much peak memory each task was using. And to do that, I created a new tool.
Measuring peak task memory usage with dask-memusage
dask-memusage is a tool for measuring peak memory usage for each task in the Dask execution graph.
- Per task because Dask executes code as a graph of tasks, and the graph determines how much parallelism can be used.
- Peak memory is important, because that is the bottleneck. It doesn’t matter if average memory usage per task is 4GB, if two parallel tasks in the graph need 12GB each at the same time, you’re going to need 24GB of RAM if you want to to run both tasks on the same computer.
Using dask-memusage
Since the gene sequencing code is proprietary and quite complex, let’s use a different example. We’re going to count the occurrence of words in some text files, and then report the top-10 most common words in each file. You can imagine combining the data later on, but we won’t bother with that in this simple example.
import sys
import gc
from time import sleep
from pathlib import Path
from dask.bag import from_sequence
from collections import Counter
from dask.distributed import Client, LocalCluster
import dask_memusage


def calculate_top_10(file_path: Path):
    gc.collect()  # See notes below

    # Load the file
    with open(file_path) as f:
        data = f.read()

    # Count the words
    counts = Counter()
    for word in data.split():
        counts[word.strip(".,'\"").lower()] += 1

    # Choose the top 10:
    by_count = sorted(counts.items(), key=lambda x: x[1])
    sleep(0.1)  # See notes below
    return (file_path.name, by_count[-10:])


def main(directory):
    # Setup the calculation:

    # Create a 4-process cluster (running locally). Note only one thread
    # per-worker: because polling is per-process, you can't run multiple
    # threads per worker, otherwise you'll get results that combine memory
    # usage of multiple tasks.
    cluster = LocalCluster(n_workers=4, threads_per_worker=1,
                           memory_limit=None)
    # Install dask-memusage:
    dask_memusage.install(cluster.scheduler, "memusage.csv")
    client = Client(cluster)

    # Create the task graph:
    files = from_sequence(Path(directory).iterdir())
    graph = files.map(calculate_top_10)
    graph.visualize(filename="example2.png", rankdir="TD")

    # Run the calculations:
    for result in graph.compute():
        print(result)
    # ... do something with results ...


if __name__ == '__main__':
    main(sys.argv[1])
Here’s what the task graph looks like:
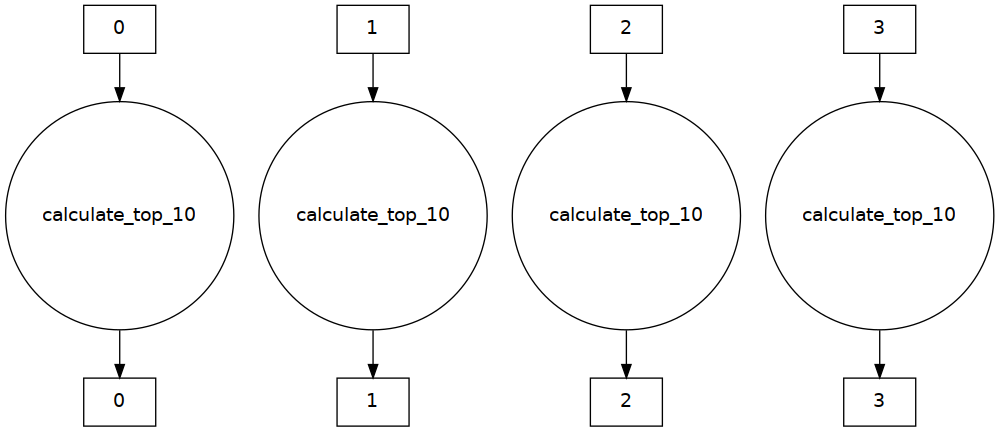
Plenty of parallelism!
We can run the program on some files:
$ pip install dask[bag] dask_memusage
$ python example2.py files/
('frankenstein.txt', [('that', 1016), ('was', 1021), ('in', 1180), ('a', 1438), ('my', 1751), ('to', 2164), ('i', 2754), ('of', 2761), ('and', 3025), ('the', 4339)])
('pride_and_prejudice.txt', [('she', 1660), ('i', 1730), ('was', 1832), ('in', 1904), ('a', 1981), ('her', 2142), ('and', 3503), ('of', 3705), ('to', 4188), ('the', 4492)])
('greatgatsby.txt', [('that', 564), ('was', 760), ('he', 770), ('in', 849), ('i', 999), ('to', 1197), ('of', 1224), ('a', 1440), ('and', 1565), ('the', 2543)])
('big.txt', [('his', 40032), ('was', 45356), ('that', 47924), ('he', 48276), ('a', 83228), ('in', 86832), ('to', 114184), ('and', 152284), ('of', 159888), ('the', 314908)])
As one would expect, the most common words are stem words, but there is still some variation in order.
Next, let’s look at the results from dask-memusage.
dask-memusage output, and how it works
You’ll notice that the actual use of dask-memusage involves just one extra line, other than the import:
dask_memusage.install(cluster.scheduler, "memusage.csv")
What this will do is poll the process at 10ms intervals for peak memory usage, broken down by task.
In this case, here’s what memusage.csv looks like:
task_key,min_memory_mb,max_memory_mb
"('from_sequence-3637e6ff937ef8488894df60a80f62ed', 3)",51.2421875,51.2421875
"('from_sequence-3637e6ff937ef8488894df60a80f62ed', 0)",51.70703125,51.70703125
"('from_sequence-3637e6ff937ef8488894df60a80f62ed', 1)",51.28125,51.78515625
"('from_sequence-3637e6ff937ef8488894df60a80f62ed', 2)",51.30859375,51.30859375
"('calculate_top_10-afc867e38c3bd0aac8c18bb00d3634ca', 2)",56.19140625,56.19140625
"('calculate_top_10-afc867e38c3bd0aac8c18bb00d3634ca', 0)",51.70703125,54.26953125
"('calculate_top_10-afc867e38c3bd0aac8c18bb00d3634ca', 1)",52.30078125,52.30078125
"('calculate_top_10-afc867e38c3bd0aac8c18bb00d3634ca', 3)",51.48046875,384.00390625
For each task in the graph we are told minimum memory usage and peak memory usage, in MB.
In more readable form:
| task_key | min_memory_mb | max_memory_mb |
|---|---|---|
| ”(‘from_sequence-3637e6ff937ef8488894df60a80f62ed’, 3)” | 51.2421875 | 51.2421875 |
| ”(‘from_sequence-3637e6ff937ef8488894df60a80f62ed’, 0)” | 51.70703125 | 51.70703125 |
| ”(‘from_sequence-3637e6ff937ef8488894df60a80f62ed’, 1)” | 51.28125 | 51.78515625 |
| ”(‘from_sequence-3637e6ff937ef8488894df60a80f62ed’, 2)” | 51.30859375 | 51.30859375 |
| ”(‘calculate_top_10-afc867e38c3bd0aac8c18bb00d3634ca’, 2)” | 56.19140625 | 56.19140625 |
| ”(‘calculate_top_10-afc867e38c3bd0aac8c18bb00d3634ca’, 0)” | 51.70703125 | 54.26953125 |
| ”(‘calculate_top_10-afc867e38c3bd0aac8c18bb00d3634ca’, 1)” | 52.30078125 | 52.30078125 |
| ”(‘calculate_top_10-afc867e38c3bd0aac8c18bb00d3634ca’, 3)” | 51.48046875 | 384.00390625 |
The bottom four lines are the interesting ones; all four start with a minimum memory usage of ~50MB RAM, and then memory may or may not increase as the code runs.
How much it increases presumably depends on the size of the files; most of them are quite small, so memory usage doesn’t change much.
One file uses much more maximum memory than the others, 384MB of RAM; presumably it’s big.txt which is 25MB, since the other files are all smaller than 1MB.
The mechanism used, polling peak process memory, has some limitations:
- You’ll notice there’s a
gc.collect()at the top of thecalculate_top_10(); this ensures we don’t count memory from previous code that hasn’t been cleaned up yet. - There’s also a
sleep()at the bottom ofcalculate_top_10(). Because polling is used, tasks that run too quickly won’t get accurate information—the polling happens every 10ms or so, so you want to sleep at least 20ms. - Finally, because polling is per-process, you can’t run multiple threads per worker, otherwise you’ll get results that combine memory usage of multiple tasks.
Interpreting the data
What we’ve learned is that memory usage of calculate_top_10() grows with file size; this can be used to characterize the memory requirements for the workload.
That is, we can create a model that links data input sizes and required RAM, and then we can calculate the required RAM for any given level of parallelism.
And that can guide our choice of hardware, if we assume one task per CPU core.
Going back to my original motivating problem, the gene sequencing pipeline: using the data from dask-memusage, I was able to come up with a formula saying “for this size input, this much memory is necessary”.
Whenever we ran a batch job we could therefore set the parallelism as high as possible given the number of CPUs and RAM on the machine.
While this allowed for more parallelism, it still wasn’t sufficient—processing was still using a huge amount of RAM, RAM that we had to pay for either with time (by using less CPUs) or money (by paying for more expensive virtual machines that more RAM). So the next step was to reduce memory usage.
Reducing memory usage with Fil
If we look at the dask-memusage output for our word-counting example, the memory usage seems rather high: for a 25MB file, we’re using 330MB of RAM to count words.
Thinking through how an ideal version of this code might work, we ought to be able to process the file with much less memory (for example we could redesign our code to process the file line by line, reducing memory).
And that’s another way in which dask-memusage can be helpful: it can point us at specific code that needs memory usage optimized, at the granularity of a task.
A task can be a rather large chunk of code, though, so the next step is to use a memory profiler that can point to specific lines of code.
When working on the gene sequencing tool I used the memory_profiler package, and while that worked, and I managed to reduce memory usage quite a bit, I found it quite difficult to use.
It turns out that for batch data processing, the typical use case for Dask, you want a different kind of memory profiler.
So after I’d left that job, I created a memory profiler called Fil that is expressly designed for finding peak memory usage.
Unlike dask-memusage, which can be run on production workloads, Fil slows down your execution and has other limitations I’m currently working on (it doesn’t support multiple processes, as of March 2021), so for now it’s better used for manual profiling.
We can write a little script that only runs on big.txt:
from pathlib import Path
from example2 import calculate_top_10

calculate_top_10(Path("files/big.txt"))
Run it under Fil:
pip install filprofiler
fil-profile run example3.py
And the result shows us where the bulk of the memory is being allocated:
Reading in the file takes 8% of memory, but data.split() is responsible for 84% of memory.
Perhaps we shouldn’t be loading the whole file into memory and splitting the whole file into words, and instead we should be processing the file line by line.
A good next step if this were real code would be to fix the way calculate_top_10() is implemented.
Next steps
What should you do if your Dask workload is using too much memory?
If you’re running Dask workloads with the Distributed backend, and you’re fine with only having one thread per worker, running with dask-memusage will give you real-world per-task memory usage on production workloads.
You can then use the resulting information in a variety of ways:
- As a starting point for optimizing memory usage. Once you know which tasks use the most memory, you can then use Fil to figure out which lines of code are responsible and then use a variety of techniques to reduce memory usage.
- When possible, you can fine tune your chunking size; smaller chunks will use less memory. If you’re using Dask Arrays you can set the chunk size; with Dask Dataframes you can ensure good partition sizes.
- You can fine tune your hardware configuration, so you’re not wasting RAM or CPU cores. For example, on AWS you can choose a variety of instance sizes with different RAM/CPU ratios, one of which may match your workload characteristics.
In my original use case, the gene sequencing pipeline, I was able to use a combination of lower memory use and lower CPU use to reduce costs to a much more modest level. And when doing R&D, I was able to get faster results with the same hardware costs.
You can learn more about dask-memusage here, and learn more about the Fil memory profiler here.
blog comments powered by Disqus